Wise: Investing for the Long Term or Catching Up to competition?
After a recent sell-off I decided to take a closer look at Wise's financial situation by investigating whether Wise' step-up in costs is catch-up spending or a deliberate push to grow volumes and Platform adoption. Below I lay out how Wise makes money, what’s changed in the numbers, and what that implies for valuation.
Let’s begin - what is WISE?
Wise is a global money movement platform built to make cross-border transfers cheaper, faster and more transparent than traditional banks. At its core, it lets individuals and businesses hold and convert multiple currencies, send international payments, and spend abroad with the Wise card with pricing typically expressed as a small fee plus a low FX spread.
Wise is still run by its co-founder, Kristo Käärmann, with along-term vision to become "the" network for the world's money. Kaarmann is the largest shareholder with a 49.3% voting interest (29.5%economic).
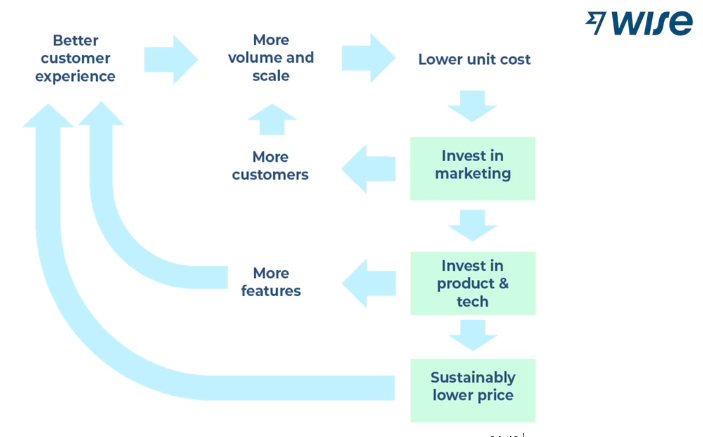
What makes Wise differentiated is how it moves money. Rather than pushing funds through a long chain of correspondent banks, Wise has built its own network by connecting directly into local payment systems across countries. That infrastructure-led approach lowers unit costs and failure points as volume scales, which is why Wise can credibly run a “lower price → more volume → more investment → lower cost” loop.
Financially, Wise earns from three main buckets:
1. Cross-border fees (the take rate on transfer volume),
2. Card and other revenues linked to account usage
3. Net interest income on customer balances, which can be meaningful when rates are high.
The debate for investors is whether Wise is still in the phase of deliberately compressing take rates to extend its long-run moat, or whether cost pressures and competition are forcing a tougher near-term trade-off.
Performance
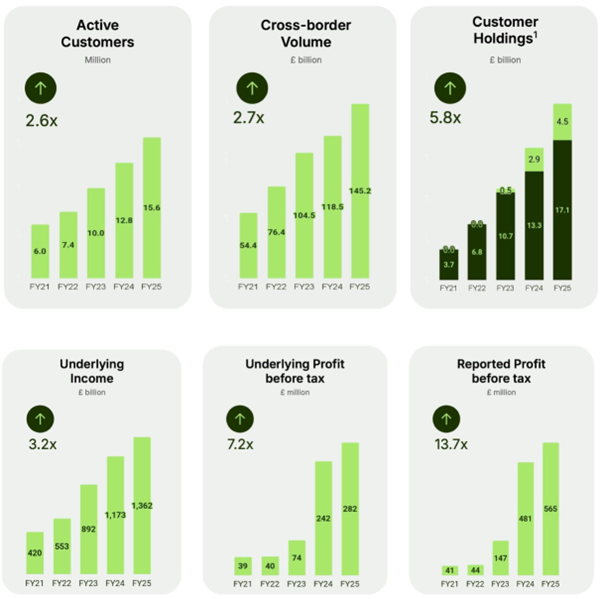
Wise’s last five years show a business that’s scaled in all the right places. More active customers using the product more often, more cross-border volume flowing through its own network, and a rapidly expanding pool of customer holdings that deepens engagement and strengthens unit economics. That combination matters because a greater share of wallet and a larger base of balances can support new features and revenues over time.
The 5-year overall performance speaks for itself
Great Product
Wise’s cross-border payment services are not only the cheapest in the world and, in most cases, the fastest, but also are provided in a unique way.
The company owns and operates its own proprietary payment infrastructure rather than relying on traditional correspondent banking rails. By building direct integrations with local payment systems across multiple countries, Wise can move money locally on both sides of a transaction instead of sending funds internationally via SWIFT. In practice, this means a customer’s money is paid into Wise locally in one country and paid out locally in another, with Wise netting flows internally across its network. This architecture significantly reduces intermediaries, FX spreads, and settlement delays, while improving reliability and transparency. Crucially, as transaction volumes scale, this network effect compounds: higher volumes improve liquidity, reduce unit costs,and allow Wise to reinvest savings into further price reductions and product expansion creating a structural advantage that is difficult for banks or newer fintechs to replicate.
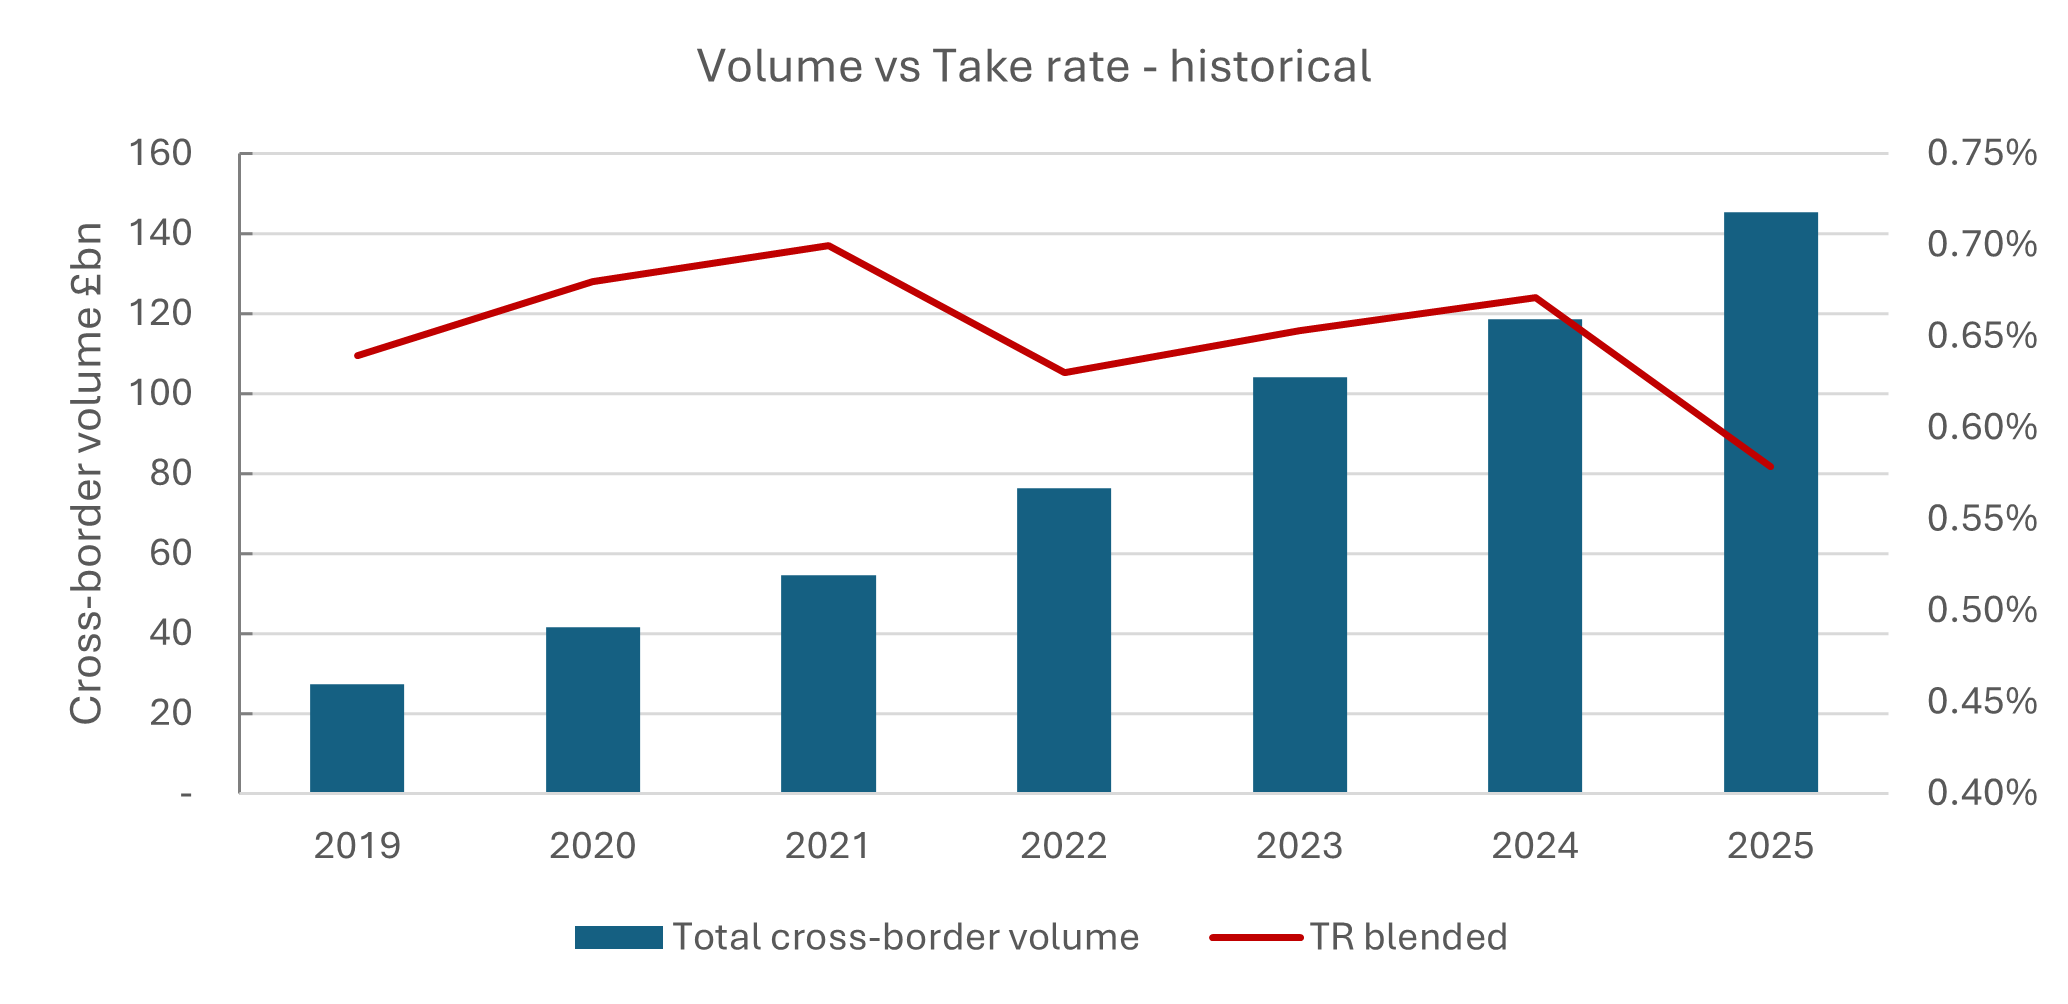
Take rate
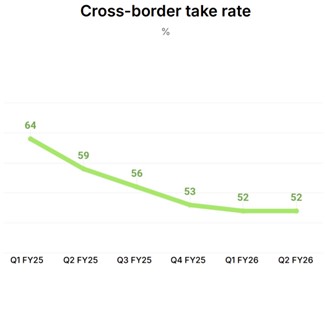
For Wise, being customer-led means recycling scale benefits back into price and product. Take rate - which is the average revenue Wise earns per unit of cross-border volume (effectively the blended price paid by customers across routes and products), has fallen from 67bps to 52bps over the last two years. On the face of it, that’s a >20% headline cut, so it naturally compresses near-term revenue yield even if volumes keep compounding.
However, Wise’s take rate has stayed structurally lower for years because it was built as a direct challenge to the “old remittance” playbook. Legacy players like Western Union and MoneyGram historically priced around cash-heavy agent networks, wider FX spreads, and convenience fees. It was a model that supported higher take rates, but also left plenty of room for a transparent, digital-first entrant to undercut on price. As the market shifted online, newer specialists (e.g., Remitly, WorldRemit) competed hard on user experience and corridor-led pricing, yet many still relied on broader monetisation via fees and spreads. Wise’s positioning has been different. The group invested early (and for years) in regulated licences, bank relationships, local integrations, and a treasury/netting setup that structurally lowers unit costs. The result is a take rate that looks “low” versus peers.
What matters is that take rate isn’t a single “price knob”. It is shaped by:
a) corridor and payment-method mix (some routes/rails are inherently cheaper or more expensive)
b) product mix (e.g., personal vs business,card-related revenue, subscriptions/ancillary fees)
c) underlying cost-to-serve and risk load (network/partner fees, fraud and reversals/refunds, customer support intensity, and the compliance burden of onboarding and monitoring)
FX volatility and local regulatory requirements can also push the floor up or down in particular markets, which is why the blended take rate can move even when headline prices look unchanged.
The key question is how structurally low Wise can keep their take rate. A strong cash position gives management flexibility to invest ahead of demand (automation, licences, direct connections to local payment systems) and bridge periods where pricing is more aggressive. But cash doesn’t make a sub-economic take rate permanent. In a steady state, the take rate needs to sit above the true all-in unit cost, or be sustainably offset by another profit pool (ex. net interest income on customer balances when rates are supportive). If unit costs don’t keep stepping down, or if interest income normalises while competition remains intense, Wise may still deliver growth, but the “price-led” part of the algorithm becomes harder to extend without trade-offs elsewhere.
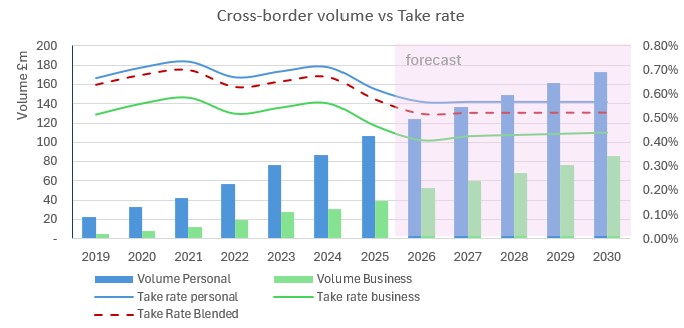
In my model, I treat Wise Business as structurally lower-priced than Personal, reflecting its larger transfer sizes (FY25 Volume-per-customer Business ~£55k vs VPC Personal ~£7k). I therefore model the group take rate as a volume-weighted blend of the two segments. Therefore if the Business grows as a share of volume, the blended take rate mechanically drifts lower even without price cuts. To keep the scenarios internally consistent, I also link Business usage intensity (VPC) to pricing:
Optimistic case - lower take rate supports higher Business VPC growth
Conservative case - higher take rate dampens VPC growth.
In short, the model tries to capture the trade-off Wise manages. Pricing down can drive usage and volume up, and the resulting mix shift matters as much as headline take rate.
Source: Wise annual reports; author calculations.
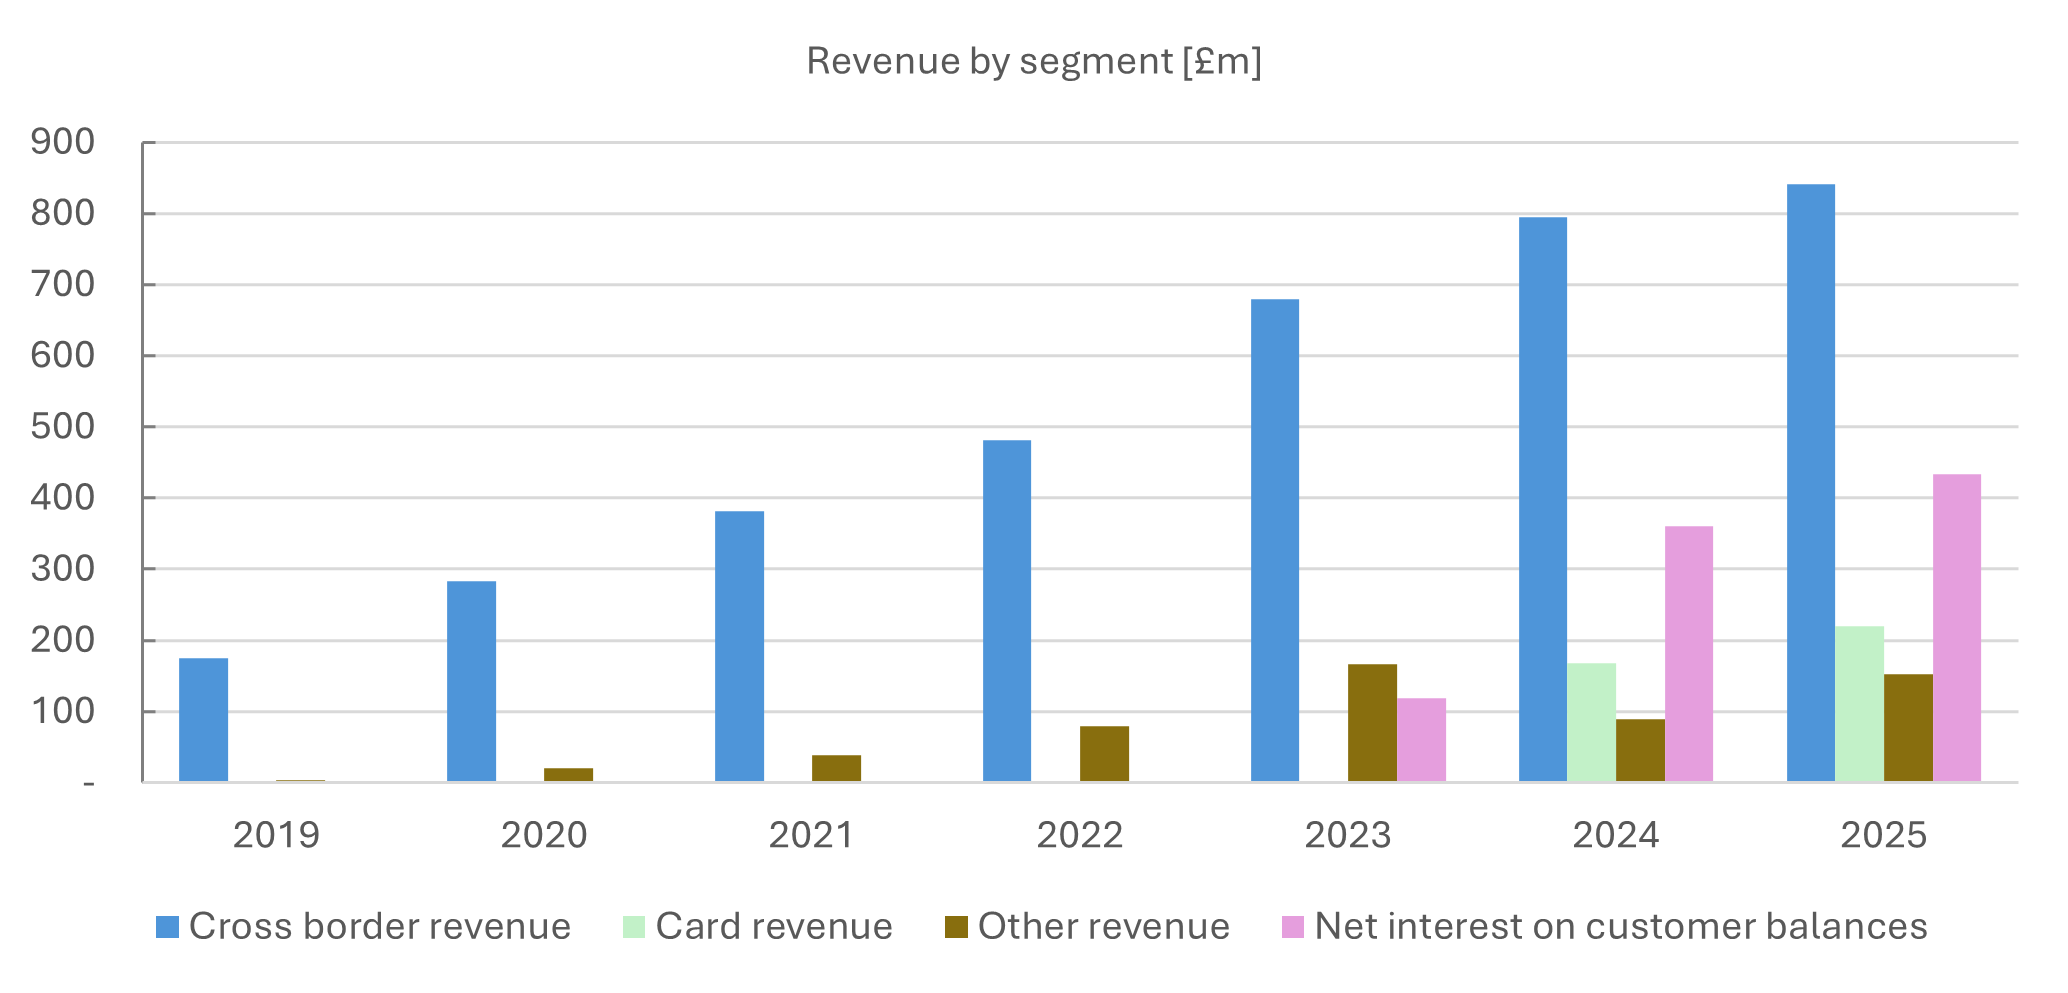
Non-cross-border Revenues on the rise
Revenues from non-cross-border (i.e. card usage revenues and other) increased by 26% in H1 of 2026, and now account for 33% of revenues (up from 29% in H1 25).
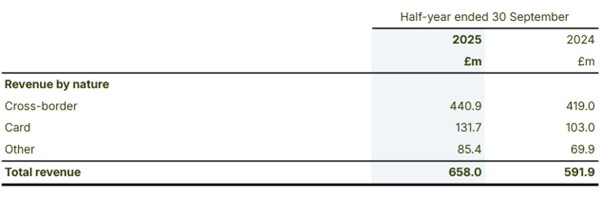
As card and ‘other’ usage shifts Wise from a “transfer app” to an everyday money account, engagement rises and churn falls, improving lifetime value and reducing reliance on cross-border fees.
Source: Wise annual reports/interims; author calculations.
If we add in net interest earned by Wise, total non-cross-border income now comprises 50% of the total (up from 44% in FY24).
Investing in new products
On the product side, Wise has kept rolling out incremental features such as under-18s Wise card (similar to Revolut’s), a travel hub that helps find nearby ATMs and country-specific fees. In the US, Wise Business has also introduced a free invoice generator. None of these are “step-change”innovations, but collectively they help keep customers engaged.
Direct connections
The more interesting investment story at Wise is the steady build-out of direct connections into domestic payment systems. These links let Wise route transfers domestically on both ends rather than through multiple correspondent banks, reducing fees, friction and manual intervention Recent examples include connecting to Brazil’s Pix and building out access to Japan’s Zengin network.
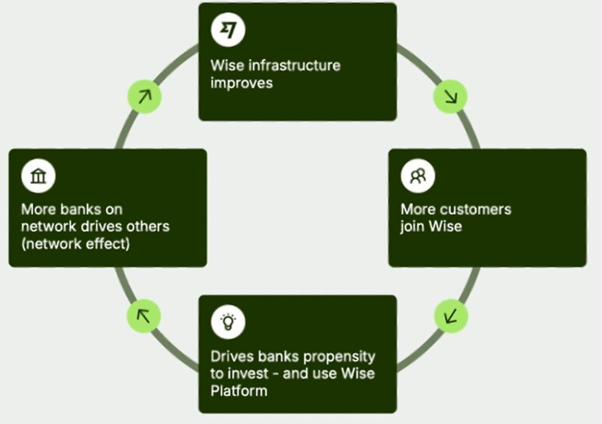
Wise Platform is another strategic lever. This is Wise’s “payments infrastructure” offering, where it provides international payment rails to other companies and financial institutions such as Monzo (UK), Nubank(Brazil) and Ramp (US). Platform’s share of Group cross-border volumes increased from 4% at the end of March to 5% in H1. Given total Group cross-border volumes grew 24% in the same period, that implies Platform volumes grew at a much faster rate (potentially >50% over six months).
What’s attractive is the embedded ramp. Once a large banking group signs, volumes can keep scaling as the integration is rolled out across subsidiaries and geographies (even without new logos). Management has emphasized an ambition for Platform to reach 10%+ of Group volumes in the medium term and 50% longer term, a shift that would make Wise’s model more infrastructure-like and, in my view, more scalable.
Finally, in H1 FY26 there was no new update on timing for a US banking licence. Wise has applied for a Trust licence in the US, which it views as a necessary step toward connecting directly into US payment systems such as Fedwire Fund Service or the RTP Network. Access to these rails would be a meaningful growth opportunity.
Back to the question – Wise is investing for long term or catching up to competition?
Let's first look at the recent expenses and target on underlying profit margin:
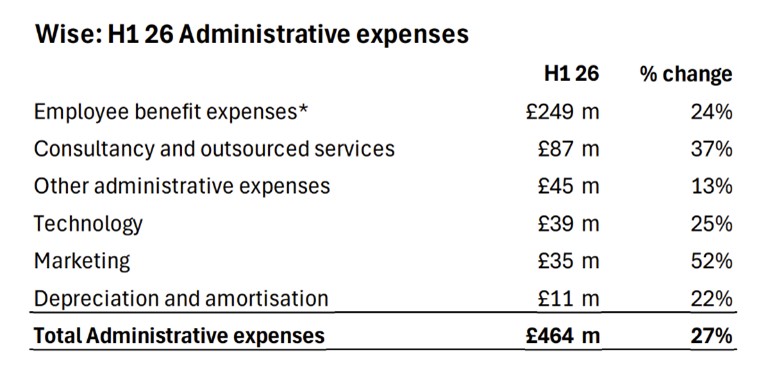
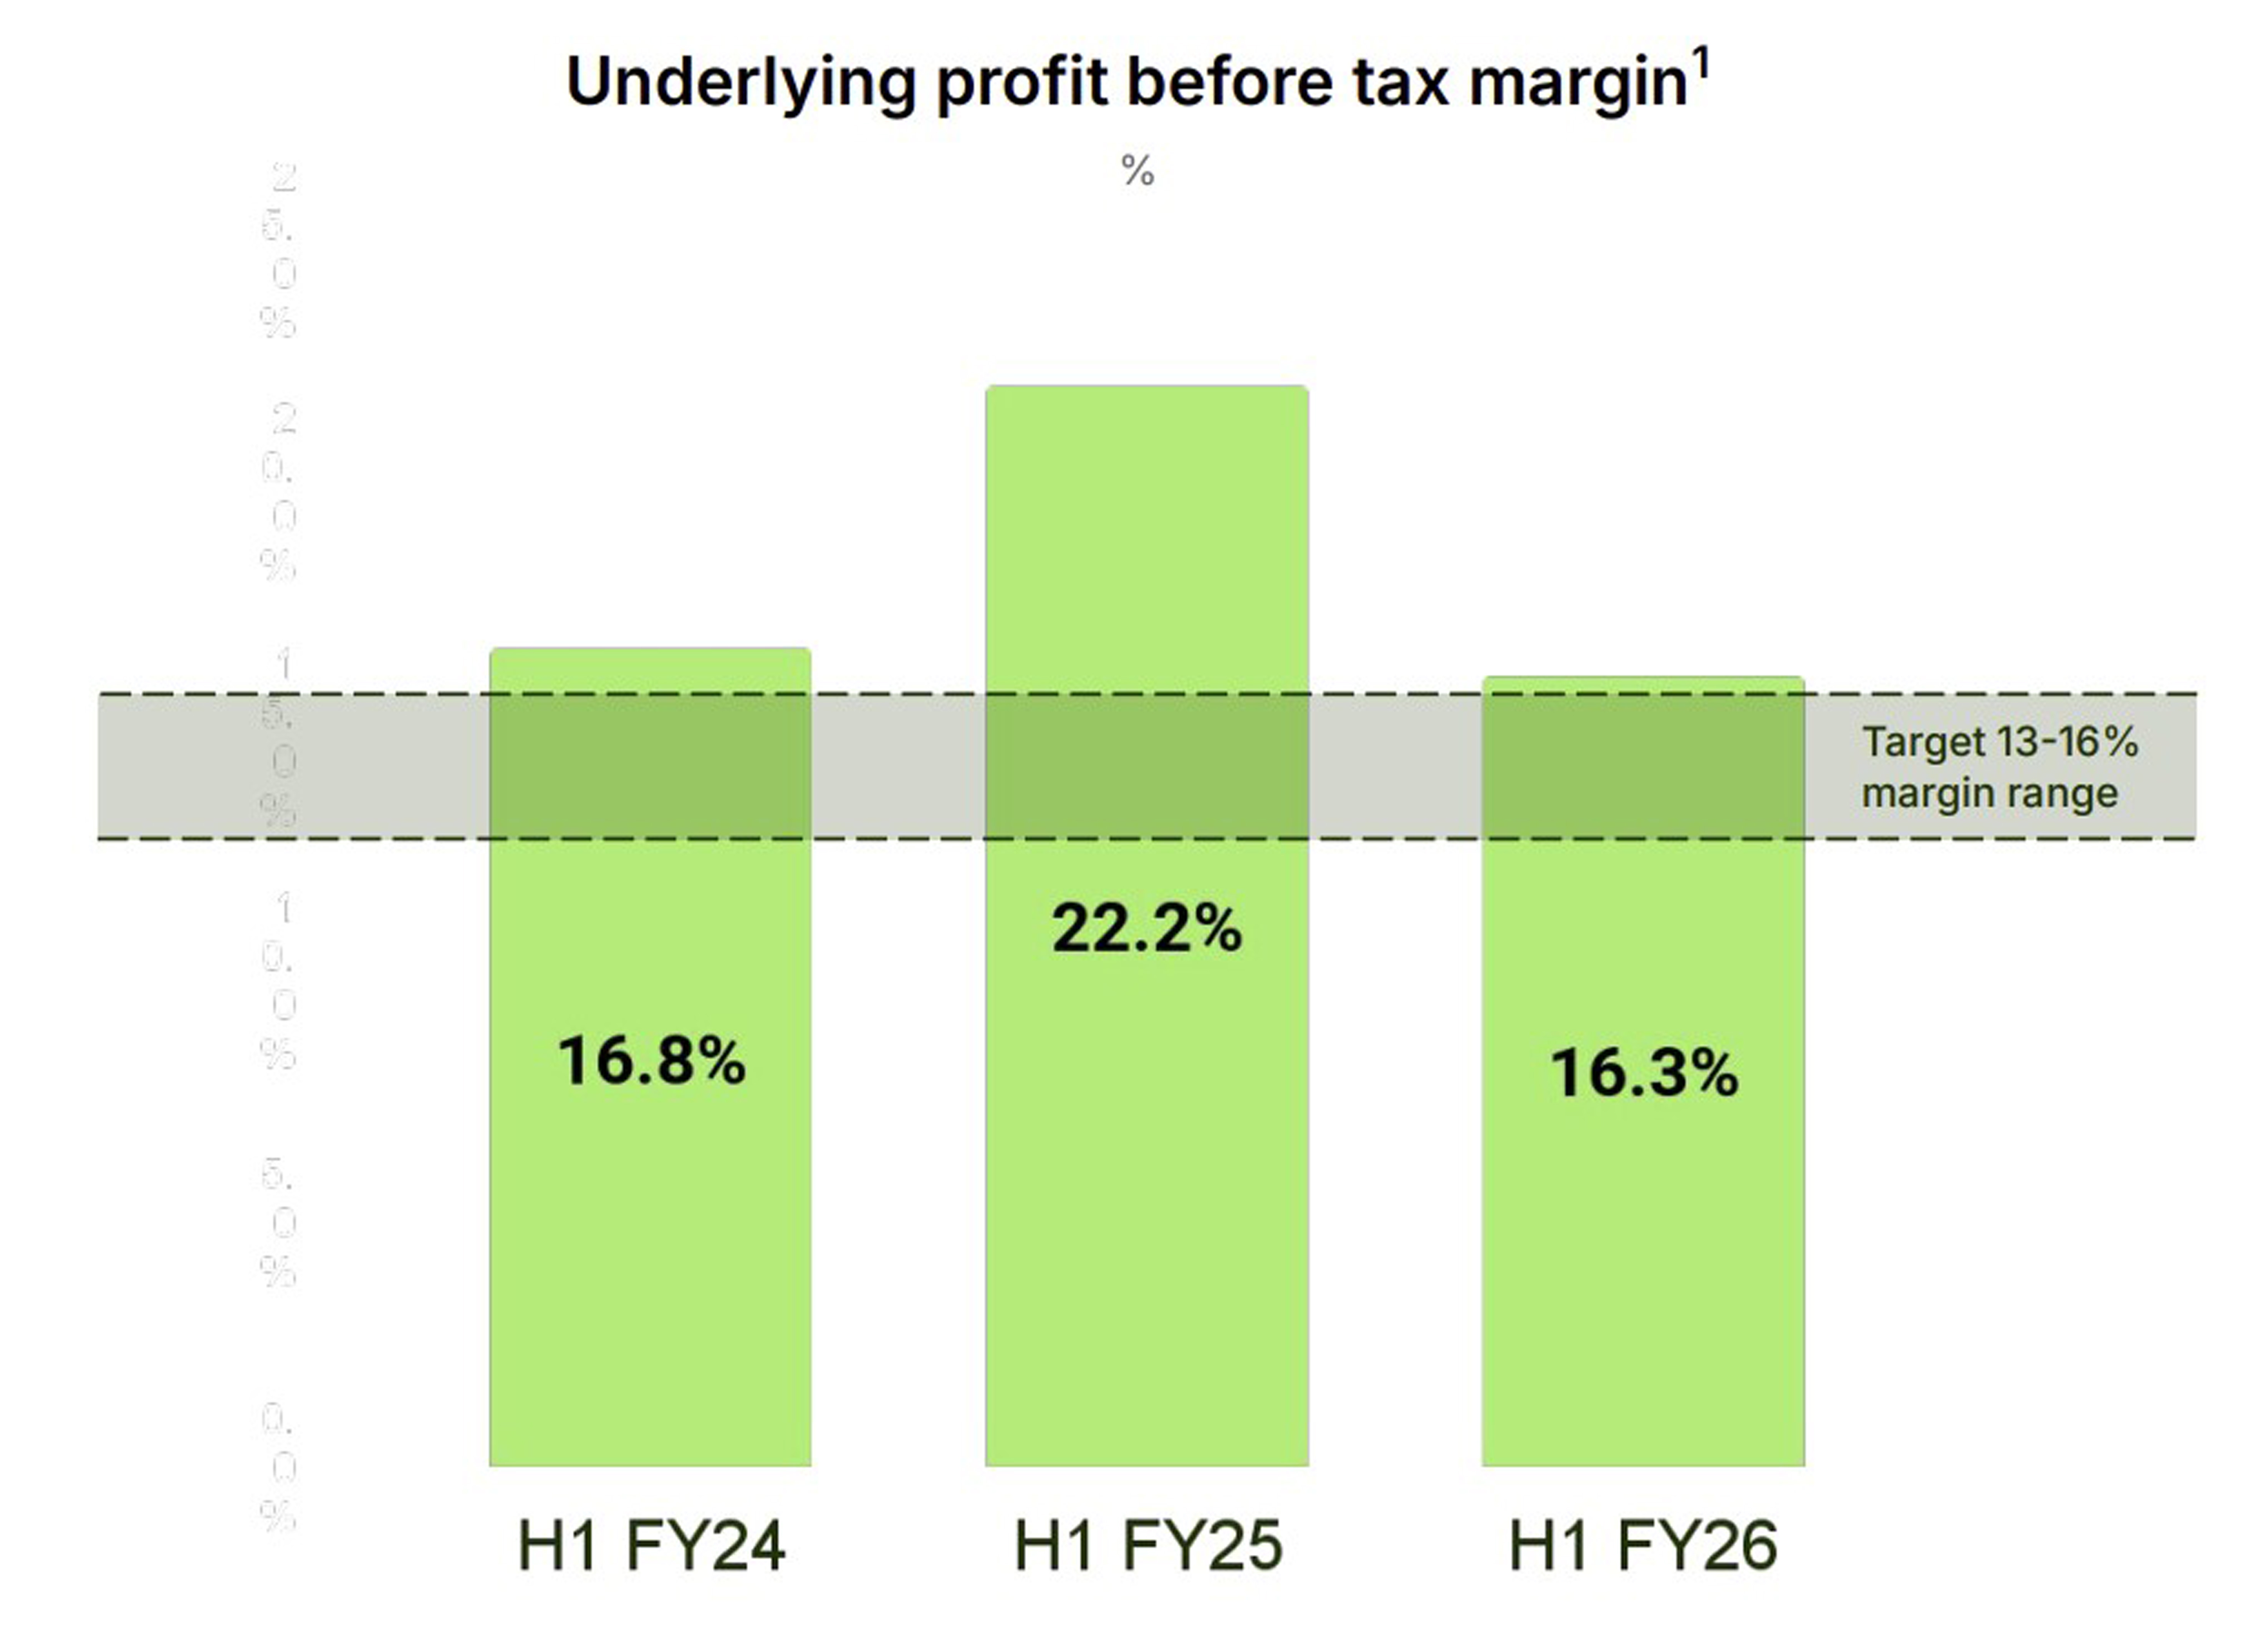
In my view, the H1 FY26 margin compression looks, at least partly, like a deliberate reinvestment choice rather than a sudden deterioration in Wise’s core economics. Wise targets a 13–16% underlying PBT margin, yet in H1 it still allowed costs to step up meaningfully. Admin expenses up 24% (excluding dual-listing costs). Management points to team expansion as the main driver, with 1,000+ net hires alongside higher spend in areas like marketing and technology, to build capacity, improve service levels and meet regulatory requirements, alongside continued rollout of AI-led efficiencies. This cost step-up came even as Group revenue grew ~11% YoY (with cross-border revenue up only ~5%), which supports the interpretation of a “build-ahead-of-demand”. The key question here is whether the higher cost base translates into stronger volume growth, a rising Platform mix and improving unit costs over the next few periods.
Underlying earnings and valuation
Net Interest on customer balances
Valuing Wise is tricky because a large part of recent profitability has come from net interest on customer balances.
- Net interest is rate-driven, so I don’t value it at today’s high level, but it’s not a one-off either. Wise holds real customer balances and should earn a structural spread on them.
In my DCF, I fade it to a normal level by assuming:
- customer balances grow, then level off
- yields fall back as rates normalise
- customer pass-through rises over time

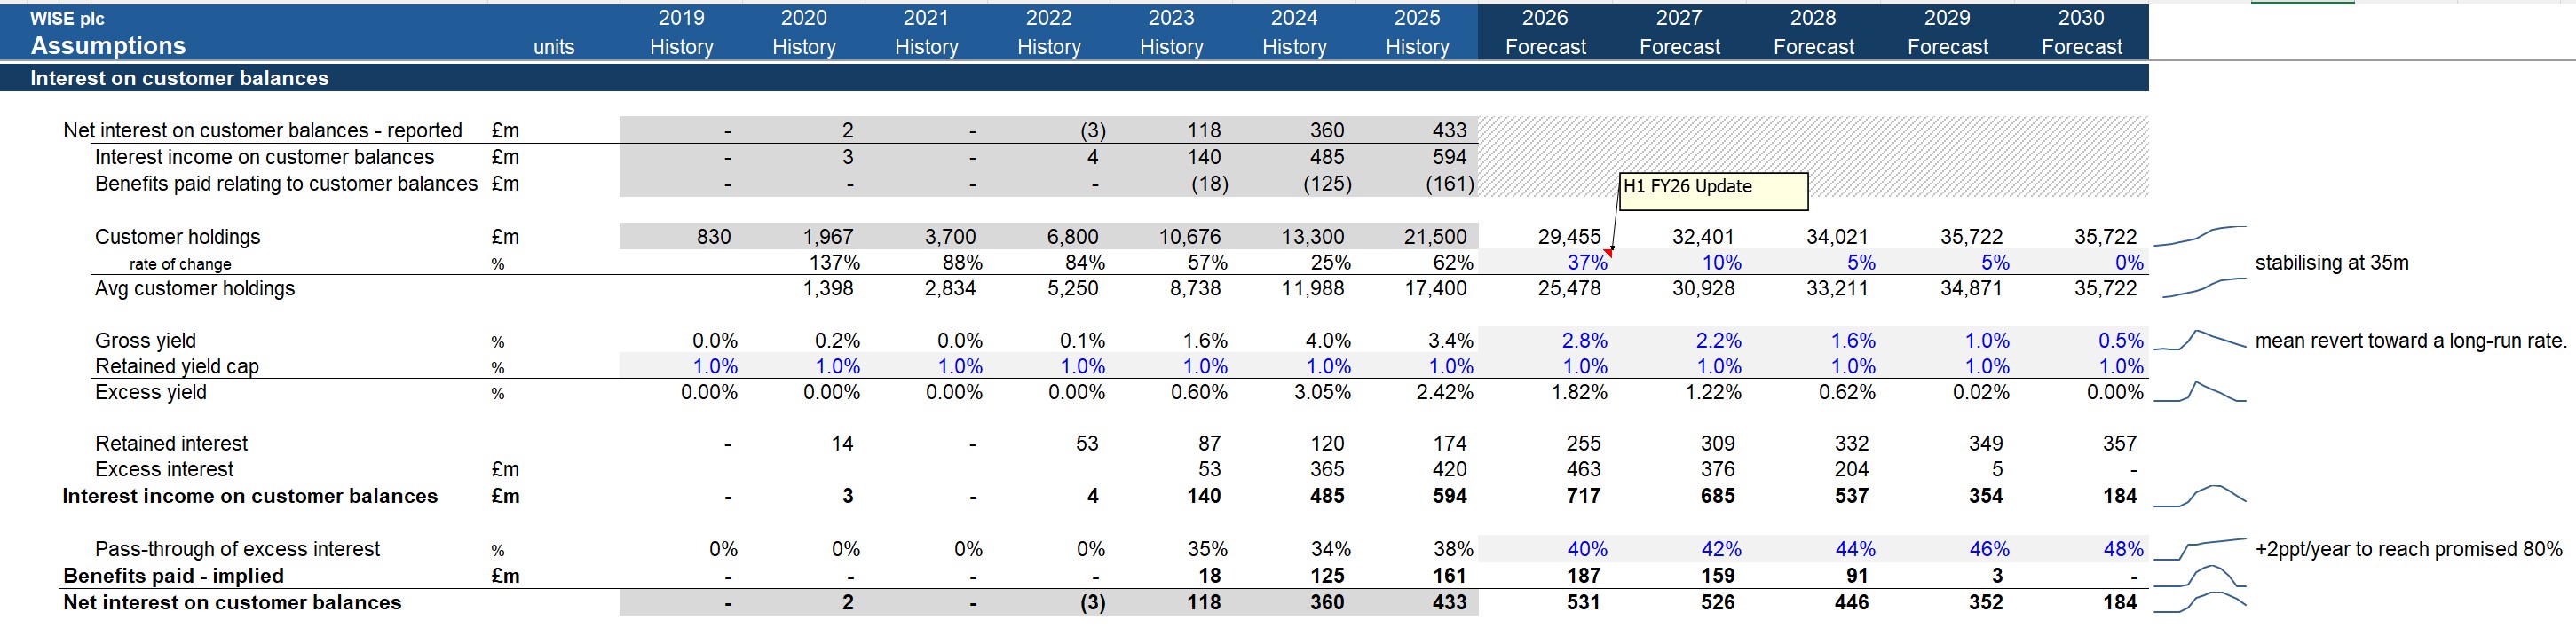
- I model net interest as: average customer holdings (Wise account balances) × gross yield (tracks rates) − customer benefits/pass-through.
- The economics are asymmetric: when rates rise, Wise earns more interest, but it shares more of the upside back with customers via benefits.
- Result: net interest is a meaningful but rate-sensitive revenue stream that will normalise if rates fall or pass-through increases.
Pass-through mechanics:
- Wise has talked about aiming to return ~80% of “excess” interest to customers via benefits.
- In FY25, my workings imply pass-through was ~38%, not 80%.
- Wise is not a traditional bank deposit model. It doesn’t simply “pay deposit interest” on Wise balances. A lot of customer give-back happens via products like Wise Interest (investment structure rather than deposit interest).
- Practically, that makes “80% pass-through” harder to implement perfectly in real time across currencies, products, and jurisdictions.
Comps
Management’s “underlying” profit metric effectively strips out the above-normal interest retained, so an underlying P/E can look high (49x- earnings are lower). Using reported LTM earnings (which include today’s higher net interest) typically produces a lower P/E of 21.3x, but that can be misleading if net interest normalises.
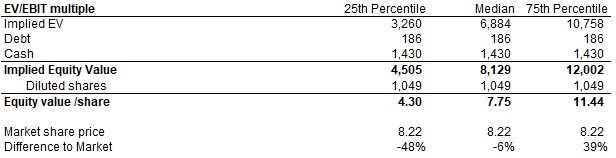
For my trading comps, I included the net interest income. I focused on a core “cross-border payments” peer bucket: dLocal, Payoneer, Euronet and Western Union. I anchored the valuation on EV/EBIT (LTM) as the cleanest profitability multiple (Wise is asset-light and D&A is relatively small, so EBIT ≈ operating profit) EV/EBITDA is shows for context.
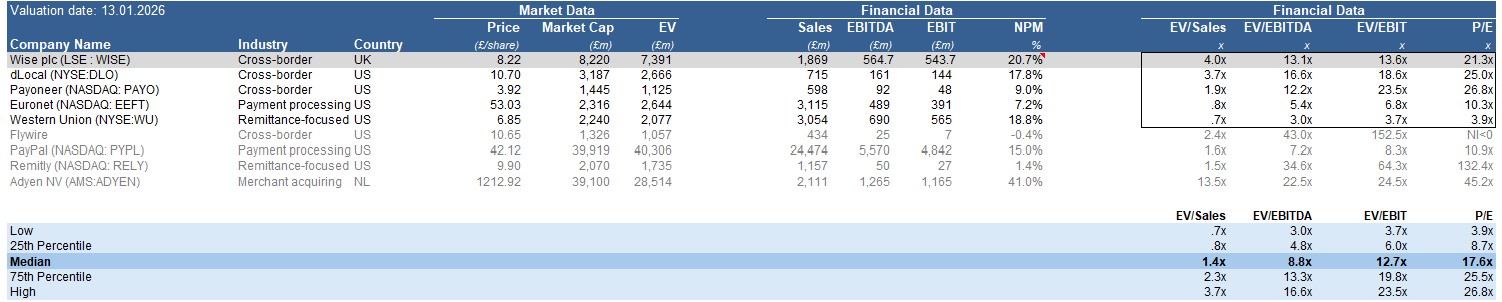
Wise should screen towards the upper end of the cross-border comp range.
- Higher profitability on NPM: Wise’s ~21% net profit margin is above most cross-border peers in the set. But part of that is net interest: Wise’s net income is boosted by net interest on customer balances in a higher-rate environment, so the NPM advantage isn’t purely fee economics.
- Wise’s scale and local rails coverage should continue to drive unit-cost improvements even as pricing declines, which is a structural differentiator vs smaller cross-border platforms.
What ultimately matters for valuation is whether Wise can keep growing cross-border volumes and Platform adoption while continuing to compress take rate without sacrificing unit economics.
If it can, the premium is justified. If not, returns lean more on interest income which can fade as rates fall and the market will punish weaker pricing.
DCF
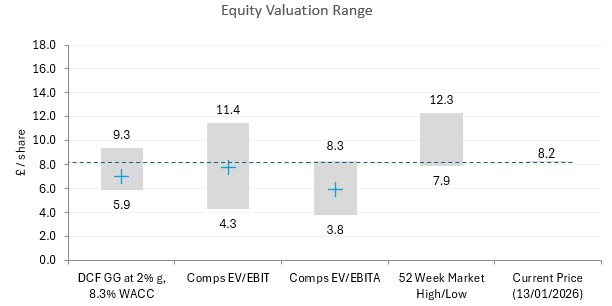
My base-case DCF implies £7.03 per share vs £8.24 current (~14% downside), using 8.3% WACC and 2.0% terminal growth.
I view this base case as conservative: under my assumptions, net interest on customer balances normalises very quickly (interest revenue falls to ~£200m by 2030 vs ~£600m in 2026), which mechanically depresses earnings despite continued growth in customers and cross-border volumes.
This might underweight the fact that:
- customer balances are structural as Wise becomes more “primary account-like”
- Wise can keep some spread even with higher pass-through
- benefits/pass-through may not rise smoothly across currencies/products/jurisdictions
So the model may be too harsh on earnings power if balances stay higher for longer, or if pass-through increases less than I’ve assumed.
On the other hand, the base case could still be optimistic if:
- take-rate compression accelerates faster than unit-cost improvement
- Revolut/other competitors push Wise into a more price-led market
- business adoption doesn’t scale as assumed (slower multi-product penetration)
The headline concern from the H1 FY26 update is that the blended cross-border take rate fell ~10bps YoY to ~52bps (0.52%). Management frames this as a deliberate price investment to drive customer growth and retention. I do not assume a re-acceleration in take rate. Despite expansion into more products/markets (which could justify higher monetisation), I model the blended take rate staying broadly flat at 0.52%, consistent with Wise's recent run rate and messaging.
Cross-border volume growth remains the primary engine. I assumed agrowing market share for the base case (+3bps YoY) in line with historic pattern plus a broader adoption via Wise Account + Platform partnerships.
Active customers grow at decelerating rate, increasingly driven by higher players and business customer adoption (with business customers highlighted as growth area).
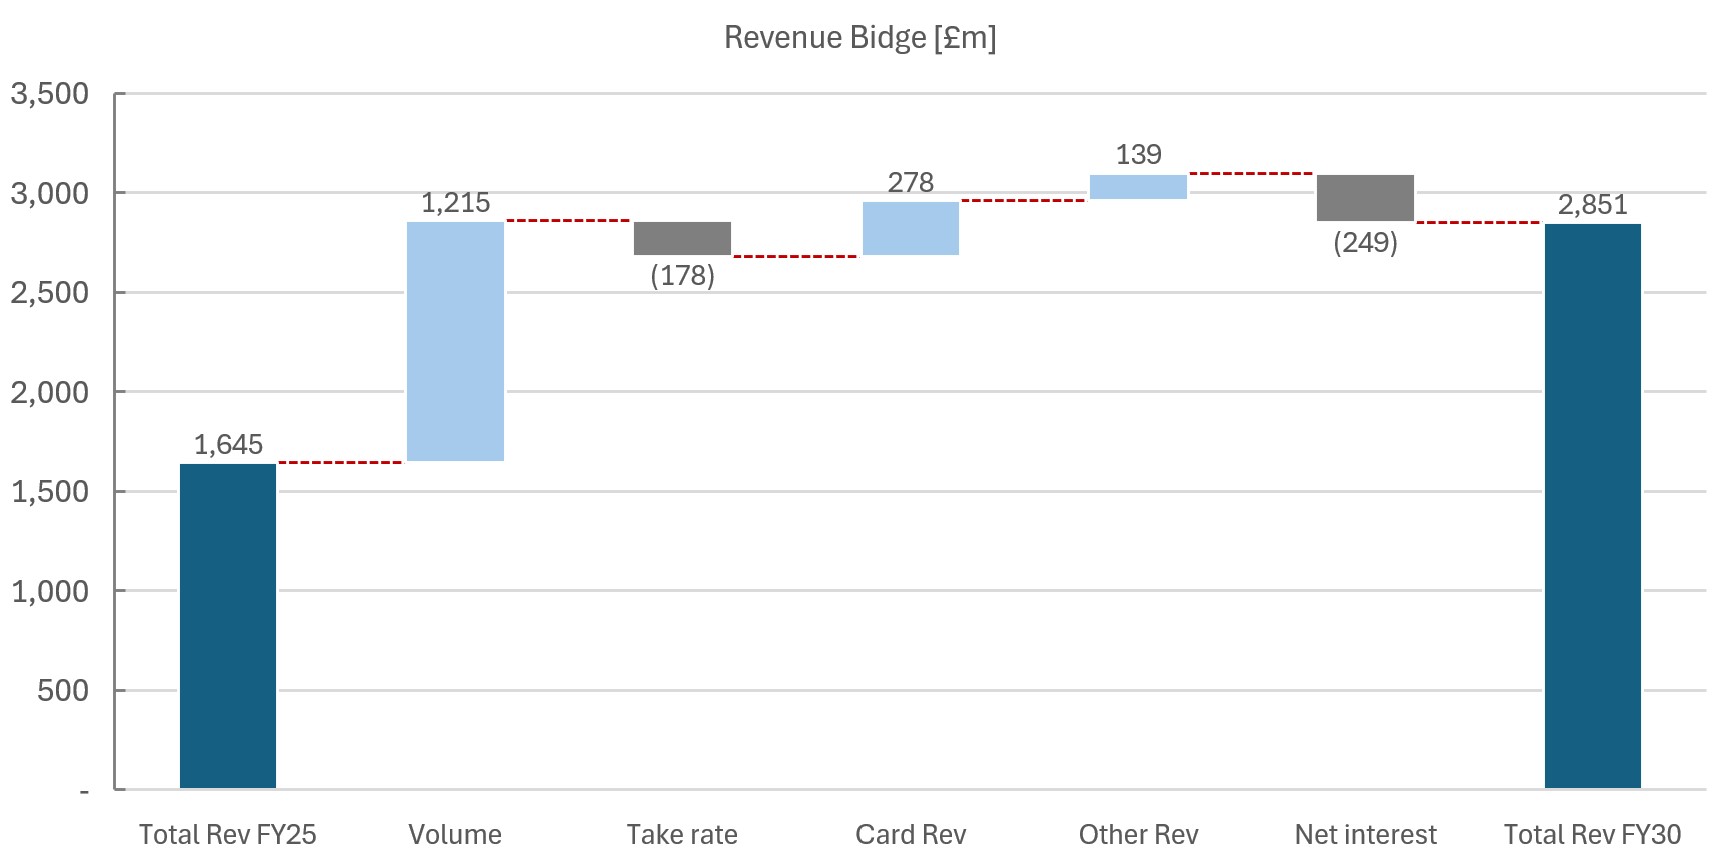
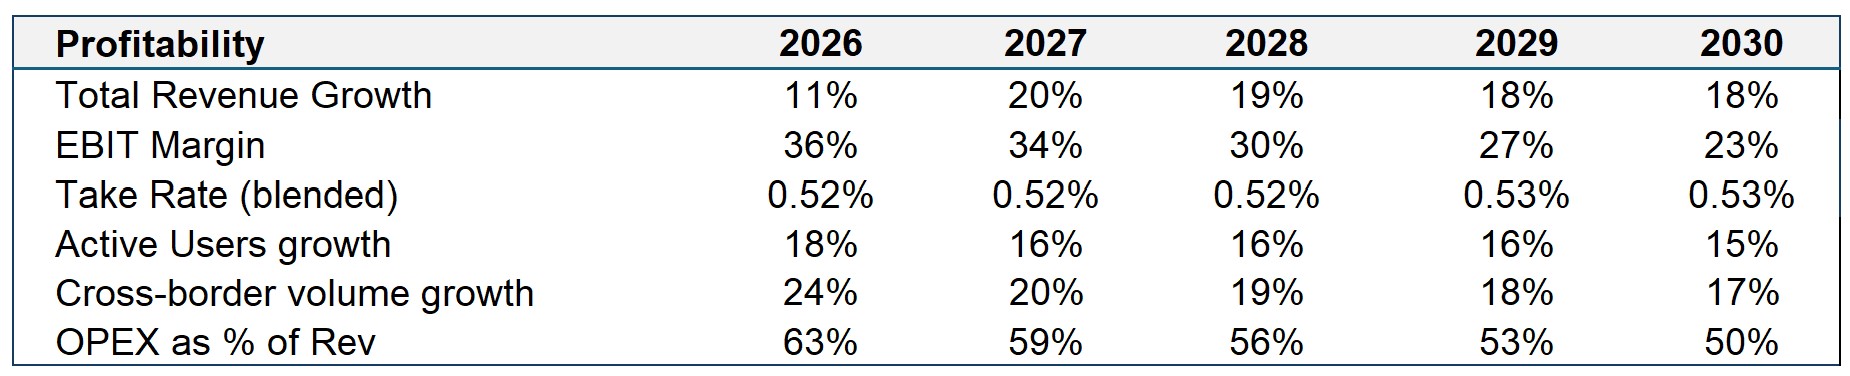
On profitability, I assume margins normalise as the exceptional interest-driven uplift fades: EBIT margin steps down from ~24% in FY26 to ~17% by FY30. In parallel, I keep reinvestment elevated — OPEX remains ~67–68% of revenue in FY26–FY28, reflecting sustained spend across growth, compliance and product expansion — before easing to ~60% in FY29 and ~58% in FY30 as scale benefits gradually offset ongoing
Summary
At £8.22, the market looks overly cautious if we believe three things can hold simultaneously:
First, that Wise can keep the blended take rate broadly stable around ~0.52% (i.e., the investment in sharper pricing doesn’t become an open-ended race to the bottom)
Second, that cross-border volumes continue compounding in the high-teens/low-20s as Wise keeps taking share and deepening usage
Third, that the business continues to diversify revenues beyond cross-border fees via the Wise Account, card and platform activity while staying disciplined against its medium-term 13–16% underlying PBT margin ambition.
In that world, a discount to intrinsic value is plausible because the equity is less a bet on near-term fee expansion and more a bet on Wise becoming the default network for moving and holding money globally.
Analyst's Disclosure: I/we have no stock, option or similar derivative position in any of the companies mentioned, but may initiate a beneficial Long position through a purchase of the stock, or the purchase of call options or similar derivatives in WISE, over the next 72 hours.
I wrote this article myself, and it expresses my own opinions. I am not receiving compensation for it. I have no business relationship with any company whose stock is mentioned in this article.
Harmonic Invest's Disclosure: Past performance is no guarantee of future results. No recommendation or advice is being given as to whether any investment is suitable for a particular investor. Harmonic Invest is not a licensed securities dealer, broker or UK investment adviser or investment bank. Harmonic Invest is managed by an individual writer who is not licensed or certified by any institute or regulatory body.